Project image
Climatescope

Evaluating global green energy investment.

Climatescope is a snapshot of where clean energy policy and finance stand today.

We worked with Development SEED team on the design of ClimateScope with a focus on providing a better, user-friendlier data experience.

  • Scope
    Data visualization
    Content strategy
    UX/UI Design
    Information architecture
  • Challenge

    Telling the story to others

    Make the complex world of data analysis a better place for the user, empowering them with confidence when investing.

    Solution

    Balance aesthetics with great usability

    Enhance data visualization for ultimate comprehension through a 0% boring UI.

Making sense of content

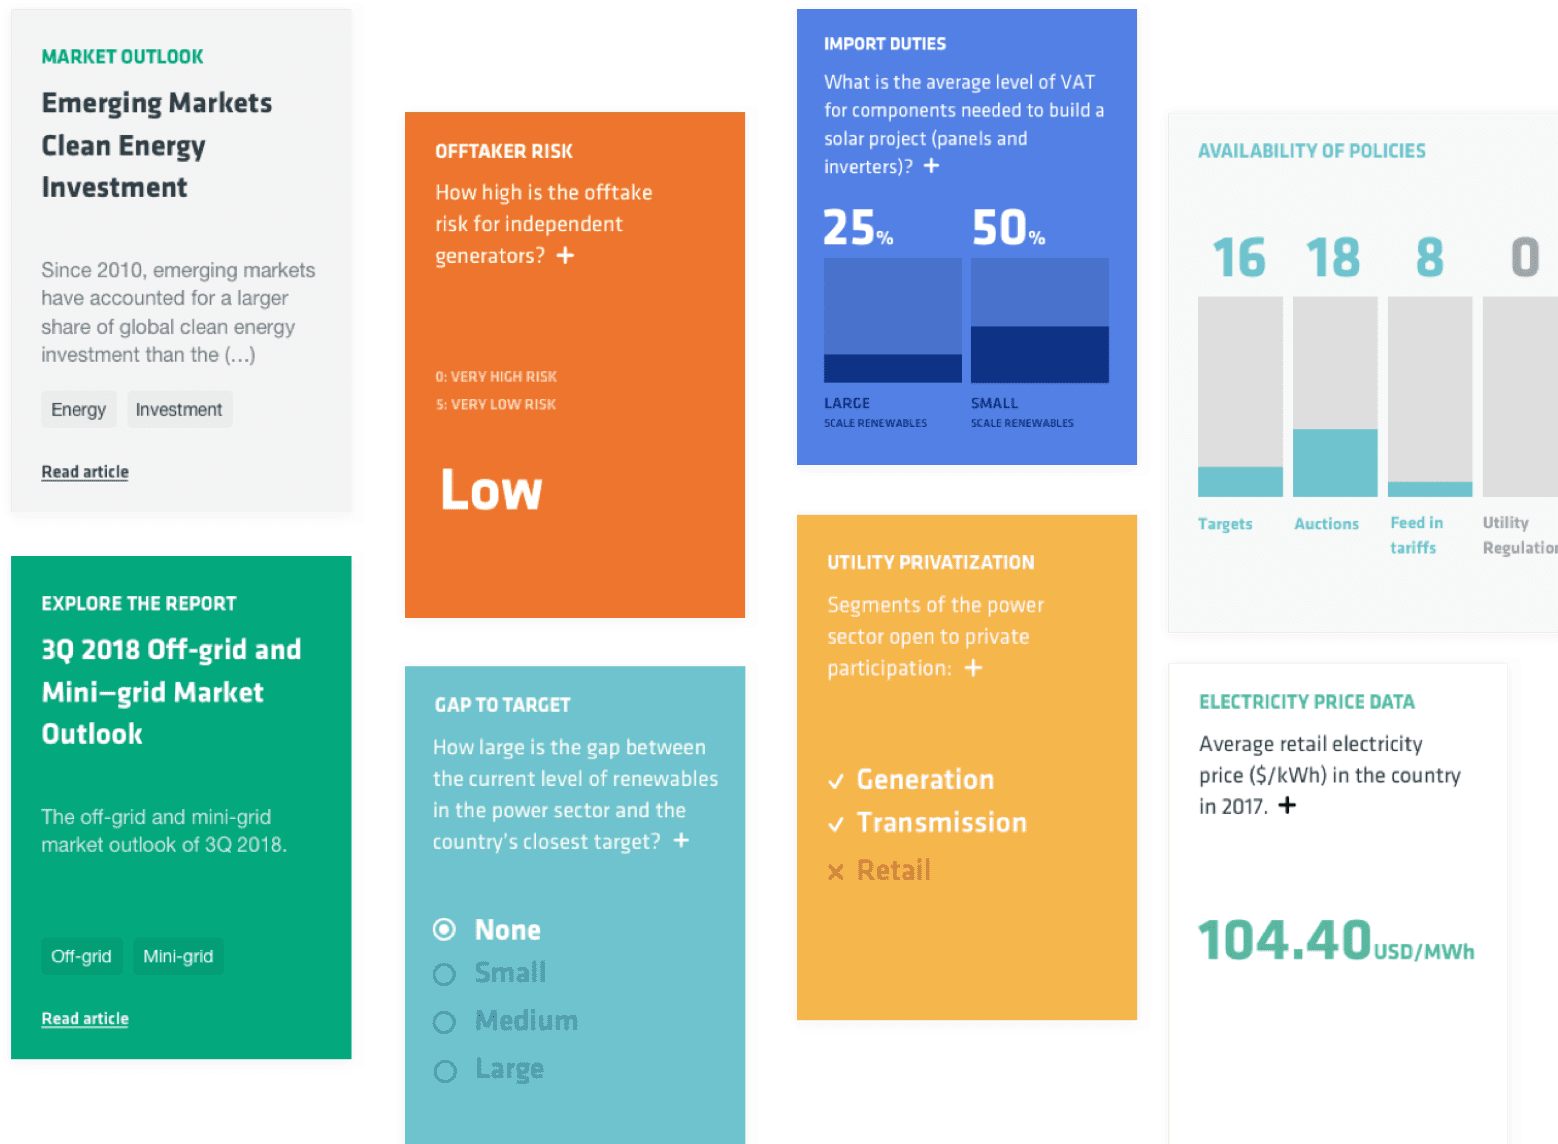
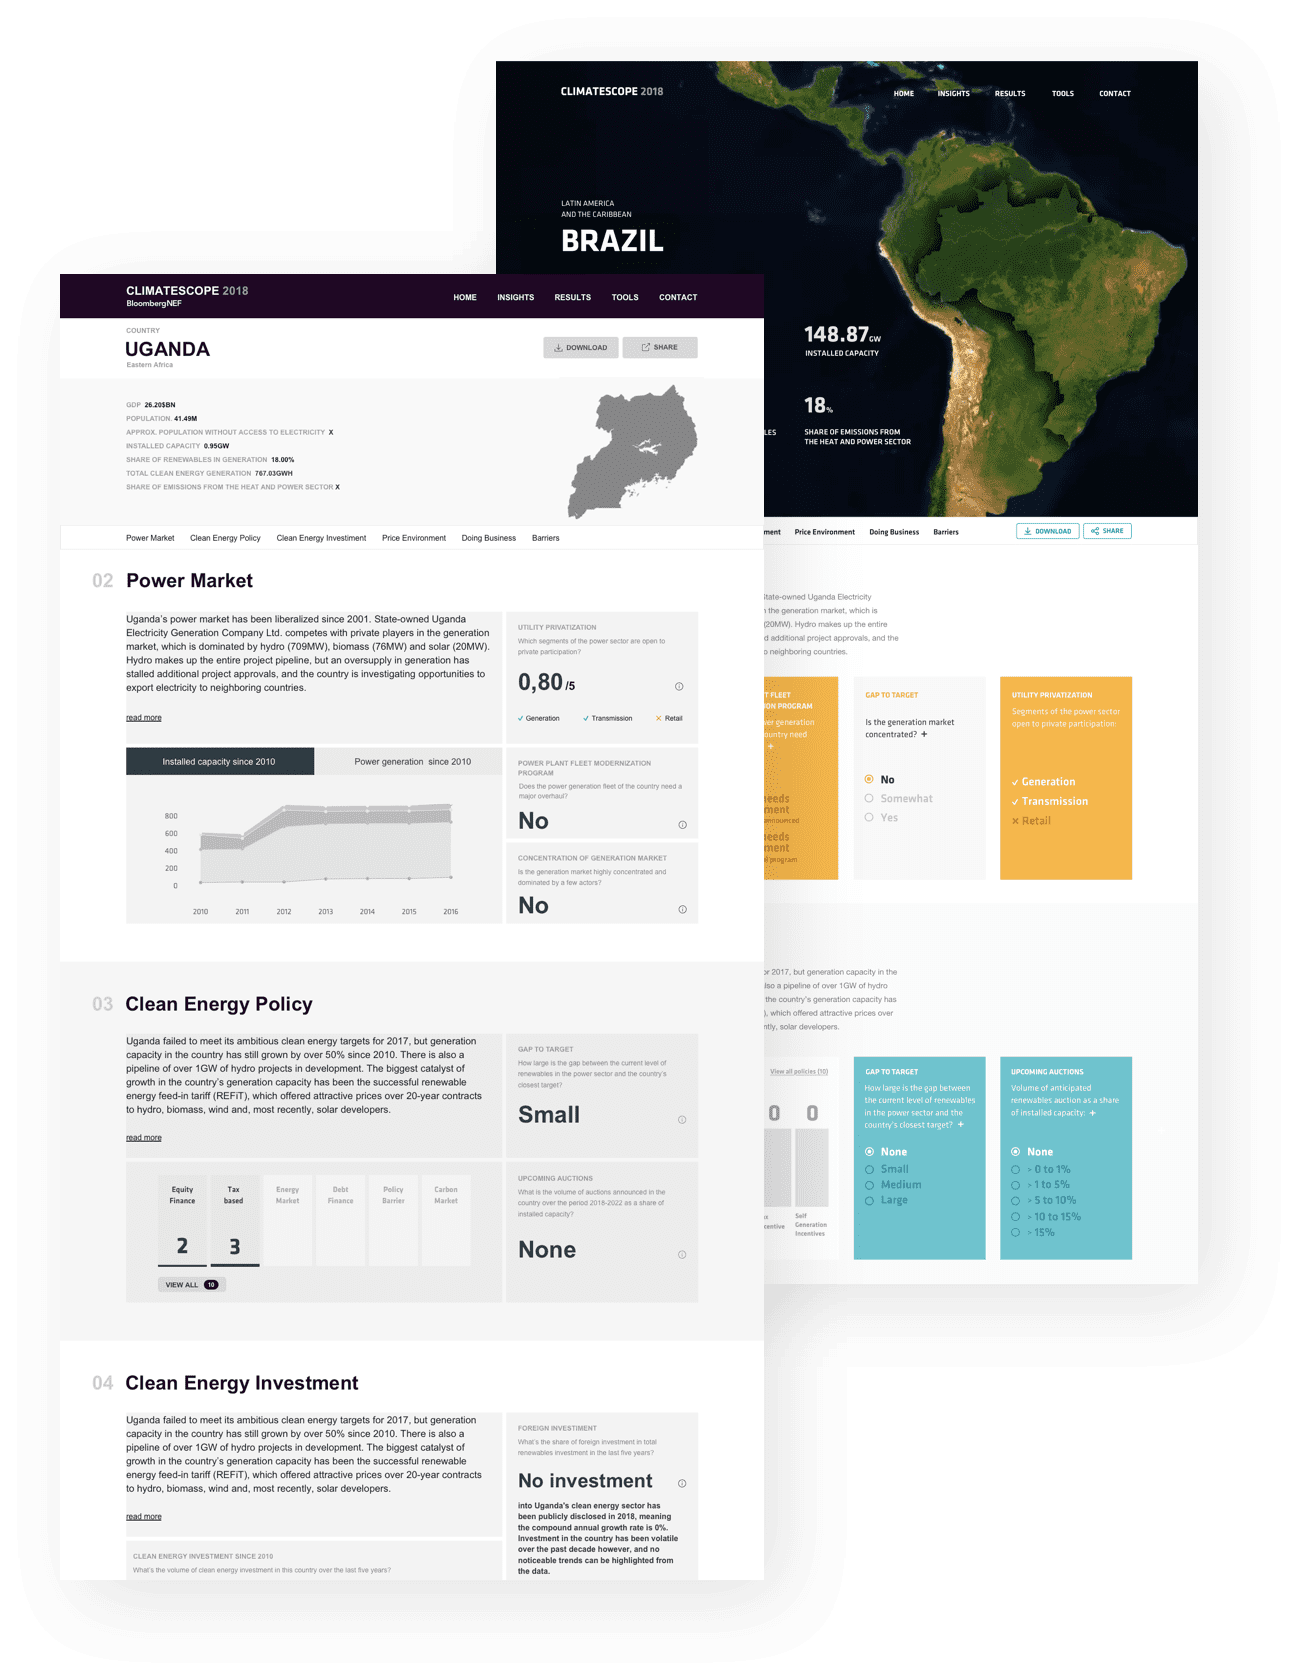
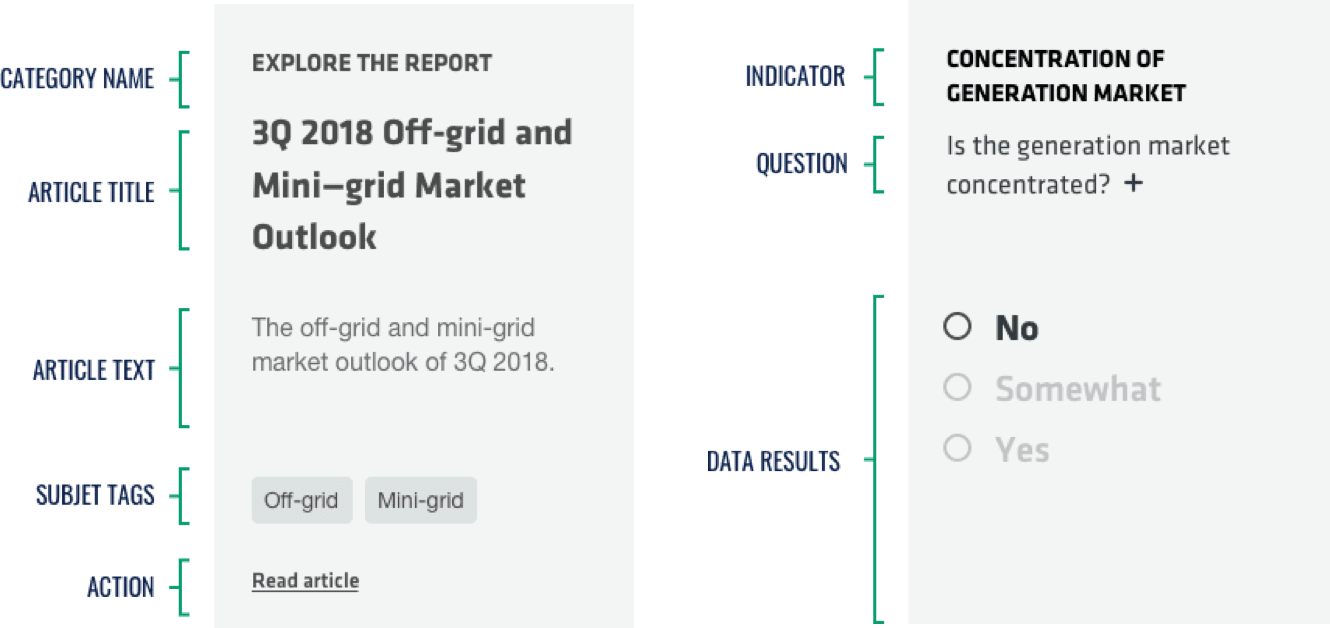
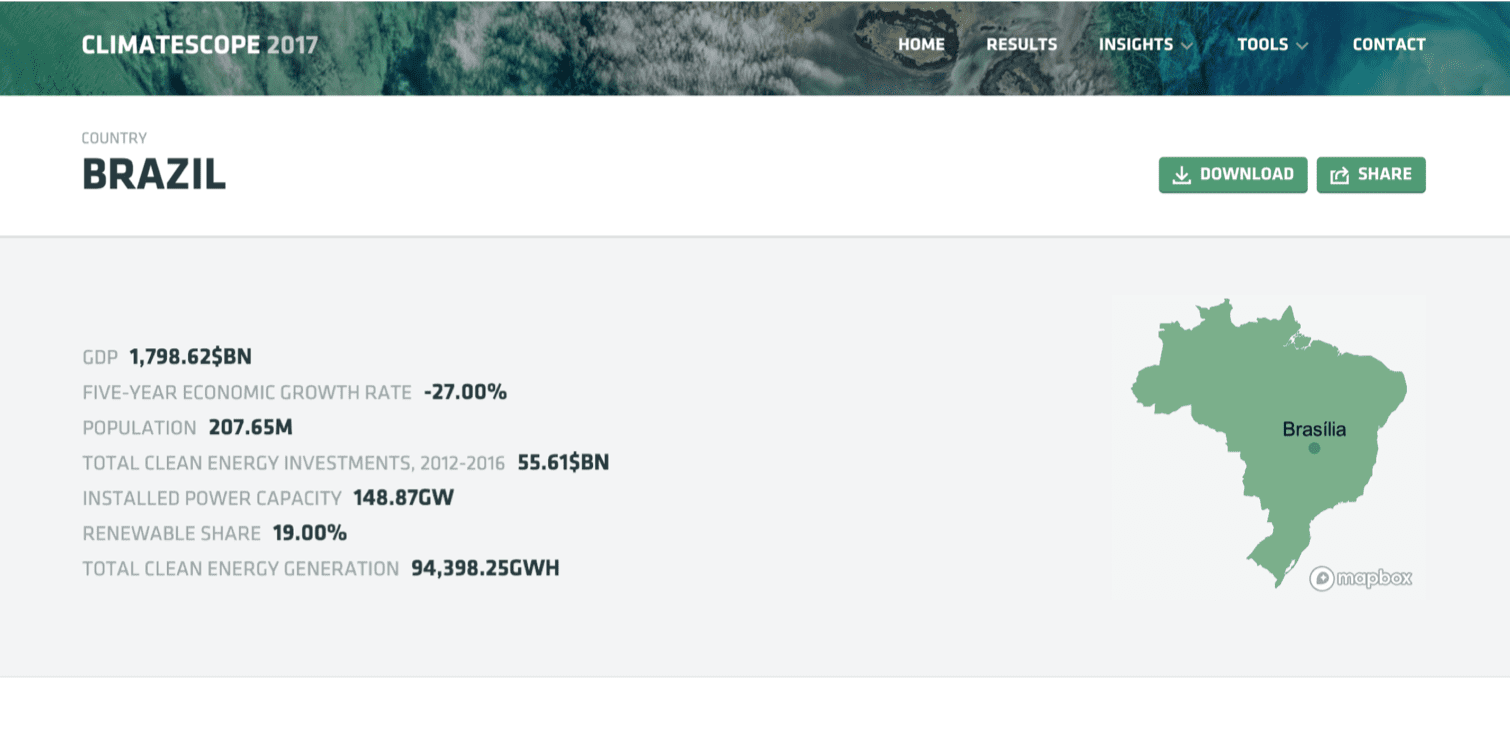
The first thing we did was take inventory of the last year data and set out to bring consistency to all the information being displayed.

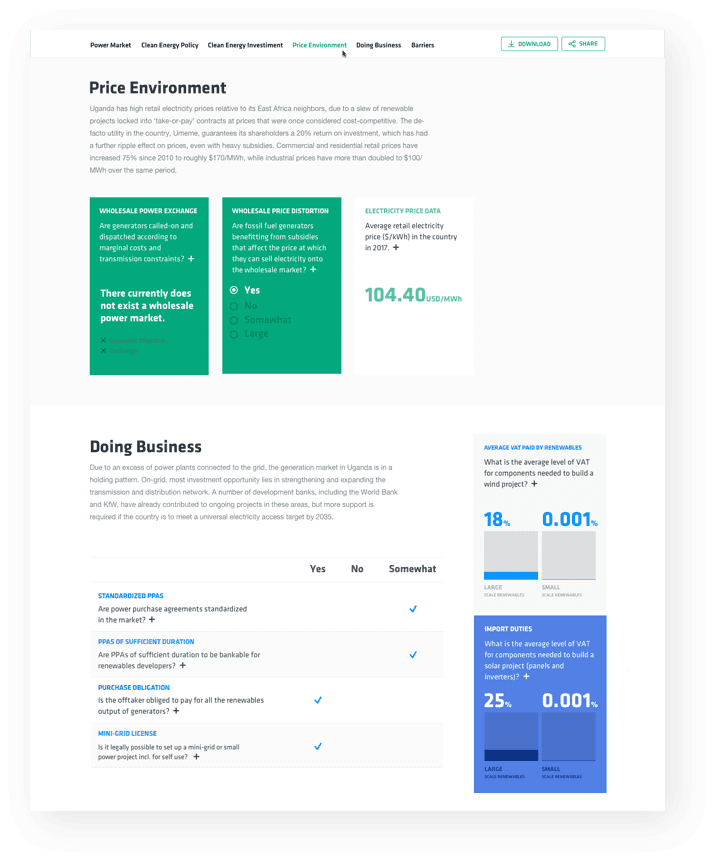
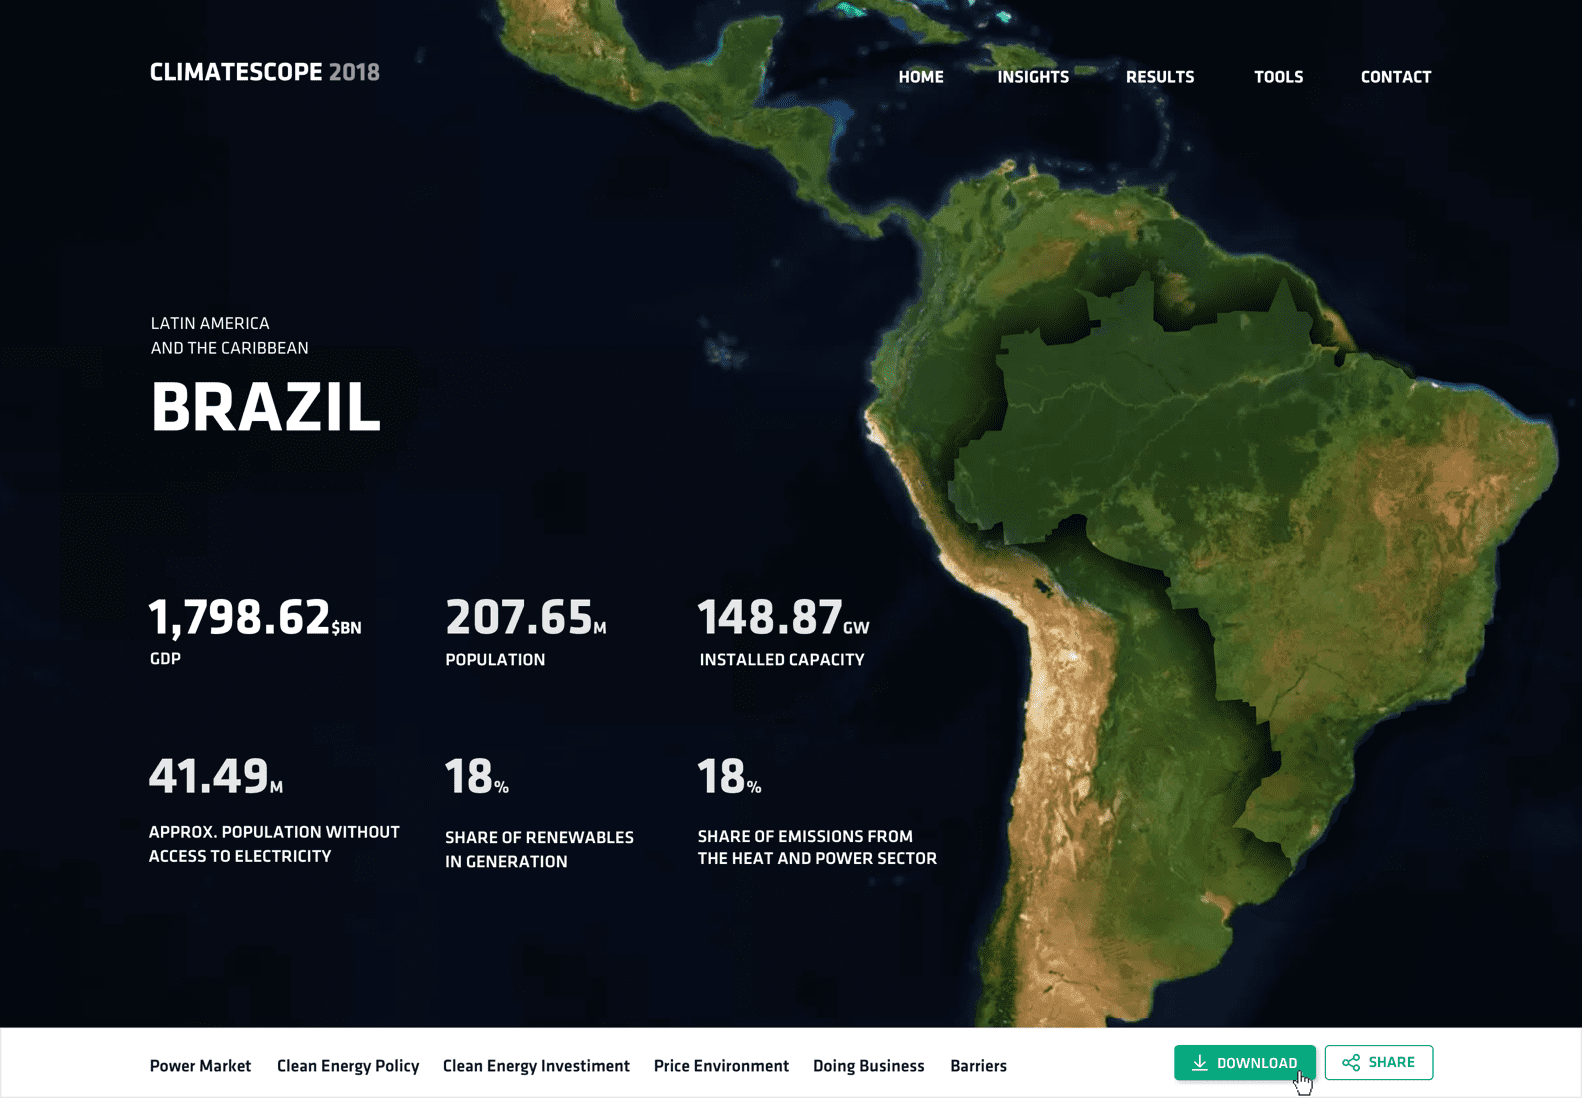
As they had a huge variety of results - numbers, percentages, text, charts, tables - this was a core problem we needed to address.

Main image

Enhanced user experience through card-based design

Each insight is delivered by completely self-contained card which maintain the same content structure, only differing in color by topic. It looks clean and tidy. Using a card-based layout makes easier for the user quickly scan the page and comprehend the information.

Main image

Card anatomy

One of the biggest advantages of cards is that they are easily scaled up or down, allowing us to design a single aesthetic across multiple devices and to secure a consistent experience regardless of the device.

Main image

Balancing aesthetics with great usability

It was really important to nail the above the fold section, to capture the user’s attention ensuring that they’ll engage with the rest of the experience as it unfolds below.

Before & after

We used satellite images instead of vectors because they provide the user with a more vivid geographic understanding of the country – borders, coast and environment.

Main image
Main image

Quick and easy navigation

As we dug deeper, it became evident that users would want to navigate through the content by sections. Instead finding the desired content by scrolling down, we opted for a more convenient user experience: housing indicators in a sticky navigation and section anchors, keeping data indicators in easy reach and enabling them to jump between them very quickly.

Main image

Partnering with Major was effortless resulting in quality work. It felt like we were working side by side.

— Daniel da Silva, Developer at Development SEED